Fourier analysis
Fourier analysis breaks images down into simpler components, and shows how to build-up images from these components as well. Here I will outline some of the basics to give you an intuition for how it works. It is actually simpler than it may appear at first; it is actually a kind of image chemistry.
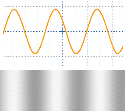
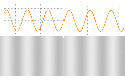
We will use sinusoidal functions as a graph of brightness.
High areas on the graph (peaks) represent
brighter areas in the image,
while the low areas (valleys) represent
dimmer areas. When we actually draw patterns that follow these graphs, we call them ‘gratings’
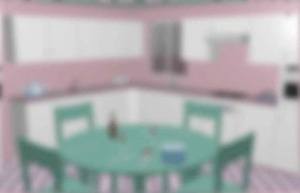
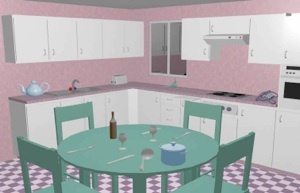
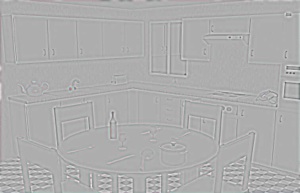
The three pictures of the kitchen above are from our discussion of spatial scales. There are a few things to notice here. First is that if you have a CSF that is shifted to the right, then you are only good at seeing high frequency gratings, which means you are only good at seeing small details. That means the world looks to you like the center picture. On the other hand, if your CSF is shifted to the left, then you are only good at seeing low spatial frequencies, and therefore large, diffuse features in the scene (like a goldfish), and the world will look like the lefthand picture. With respect to Fourier analysis, note that the lefthand image would be found to contain lots of low frequency gratings (since they are the ones that correspond to largish features, and that image only contains largish features), while the one in the center would only contain high frequency gratings (since these correspond to tiny, sharp details in the scene, and this scene only contains details). Ideally, you have an image that contains both large features and small details, and ideally you are good at seeing both!
19. ‘Fourier Analysis’ of images
1:23 PM
Images can be broken down (or assembled out of) various spatial frequency components.
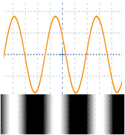
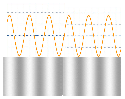
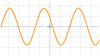
Or, we can change the frequency (the number of peaks and valleys) without changing the amplitude.
Or we could, say, raise the frequency and lower the amplitude:
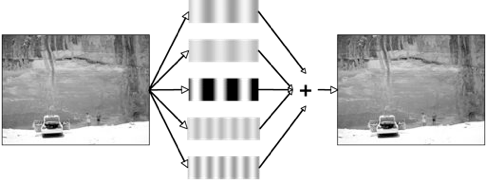
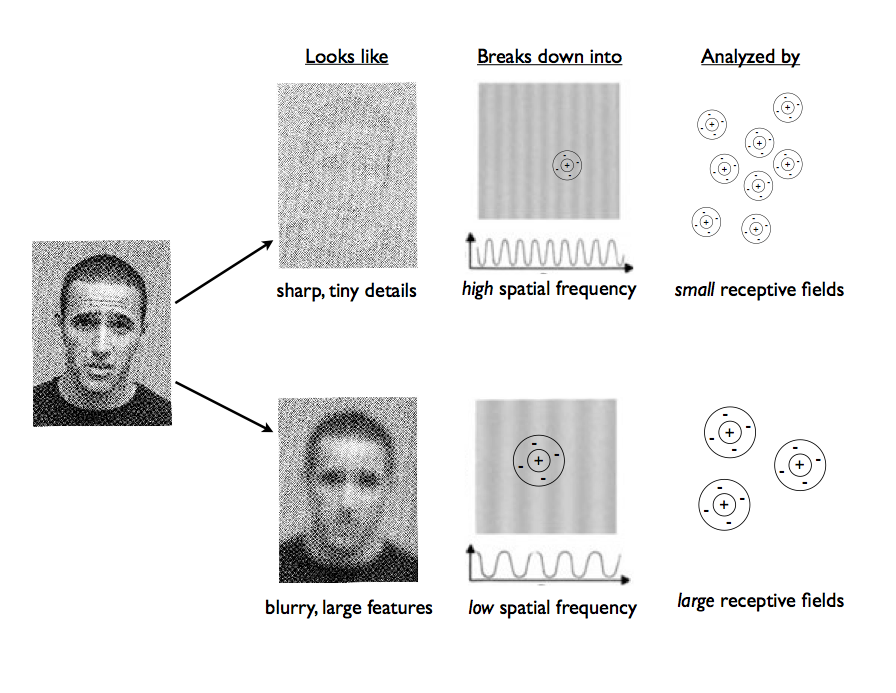
Here’s the point: we know that Fourier analysis can break down any image into a bunch of these sinusoidal gratings. Therefore, if we can figure out how well an optical or visual system can see sinusoidal gratings of various amplitudes and frequencies, we will be able to predict how well this system ‘sees’ any image whatsoever.
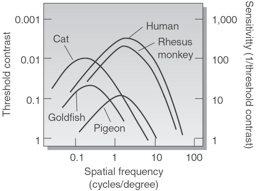
So, all we have to do is basically make a new eye test of visual acuity. Instead of using the Snellen eye chart, now we will make a test based on these sinusoidal gratings. To do this, we simply show a grating to a person, and turn down it’s contrast (amplitude) until they just can barely see it. If we can go really low with the contrast for a particular frequency grating, then we know that the person is very sensitive to that grating. We plot these results in something called a CSF or Contrast Sensitivity Function.
Let’s say we start with an image that looks like this:
Here’s one of lower amplitude. Notice the dim areas aren’t as dim and the bright areas aren’t as bright. The image is more washed-out.
+
=
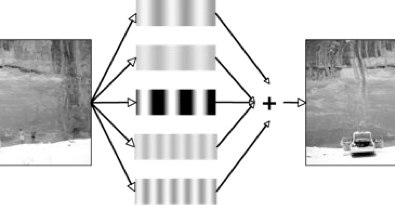
Here’s a demo of Fourier Analysis at work:
Example of a Fourier analysis of an image: