Visual acuity
There are many ways to measure ‘how good’ one’s vision is, that is, one’s visual acuity.
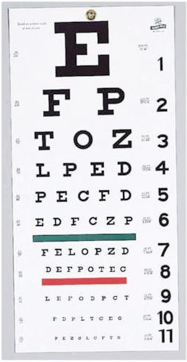
The most familiar is the Snellen eye chart, shown here. On this chart 20-20 is ‘normal’ vision, 20-40, 20-200 etc. is worse than normal, while 20-15 or 20-10, for instance, are better than normal. The first number is always 20, that’s the number of feet away from the chart that you stand. From there, we see how far down the chart you can read. The second number shows the farthest everyone else (‘normal’ people) can be from the chart to read the same line. So, if you’re reading a particular line from the chart at 20 feet, but everyone else can get 100 feet away, then your vision is 20-100, much worse than normal. If you’re reading a particular line at 20 feet away, and everyone else can only get 10 feet away and still be able to read the same line, then you have 20-10 vision, considerably better than normal. (Actually 20-10 is basically the best human vision possible).
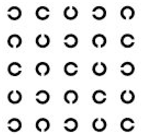
A more sophisticated version is the Landolt C test, also shown. The objective here is to see how far you can get from the chart but still reliably tell which direction the C’s are facing (up, down, left, or right)
Both of these tests unfortunately only measure how good one’s visual acuity is for fine details. They measure the smallest features that one is able to see (either the lines and gaps that define the various letters in the Snellen chart, or the small gap in the Landolt C’s).
But there is much more to visual acuity than just seeing small details, for instance, being able to see large but low-contrast features in a scene, say a deer in the road on a foggy night. To get a full test of visual acuity, one must measure an observers’ ‘Contrast Sensitivity Function’ (CSF).
13. Measuring visual acuity
1:29 PM
Visual acuity is the measure of how ‘well’ we can see - but there are many different situations our vision has to do well in.